தமிழ் (இந்தியா)
English (United Kingdom)
සෙවීම
මුල් පිටුව
අපි ගැන
හැඳින්වීම
ආයතනික ව්යුහය
අපේ කණ්ඩායම
පුරප්පාඩු
කලාප
ප්රාදේශීය කාර්යාල
රජයේ තවාන්
රබර් සංවර්ධන නිලධාරී කොට්ඨාශ
අපගේ සේවාවන්
රබර් නව/නැවත වගාව
රබර් පැල නිෂ්පාදනය
පුහුණු සහ උපදේශන සේවා
රබර් වෙළඳ බලපත්රය නිකුත් කිරීම
රබර් නිෂ්පාදකයින් ලියාපදිංචි කිරීම
පුද්ගලික රබර් පැළ තවාන් සඳහා බලපත්ර නිකුත් කිරීම
රක්ෂණ යෝජනා ක්රමය
ගැලරිය
ඡායාරූප ගැලරිය
වීඩියෝ ගැලරිය
බාගත කිරීම්
අයඳුම්පත්ර
පනත් සහ රෙගුලාසි
කාර්ය සාධන වාර්තා
ප්රකාශන
RDD
RRI
සංඛ්යා ලේඛන
අපව අමතන්න
විමසීම්
ඇමතුම් විස්තර
පුවත්
මුල් පිටුව
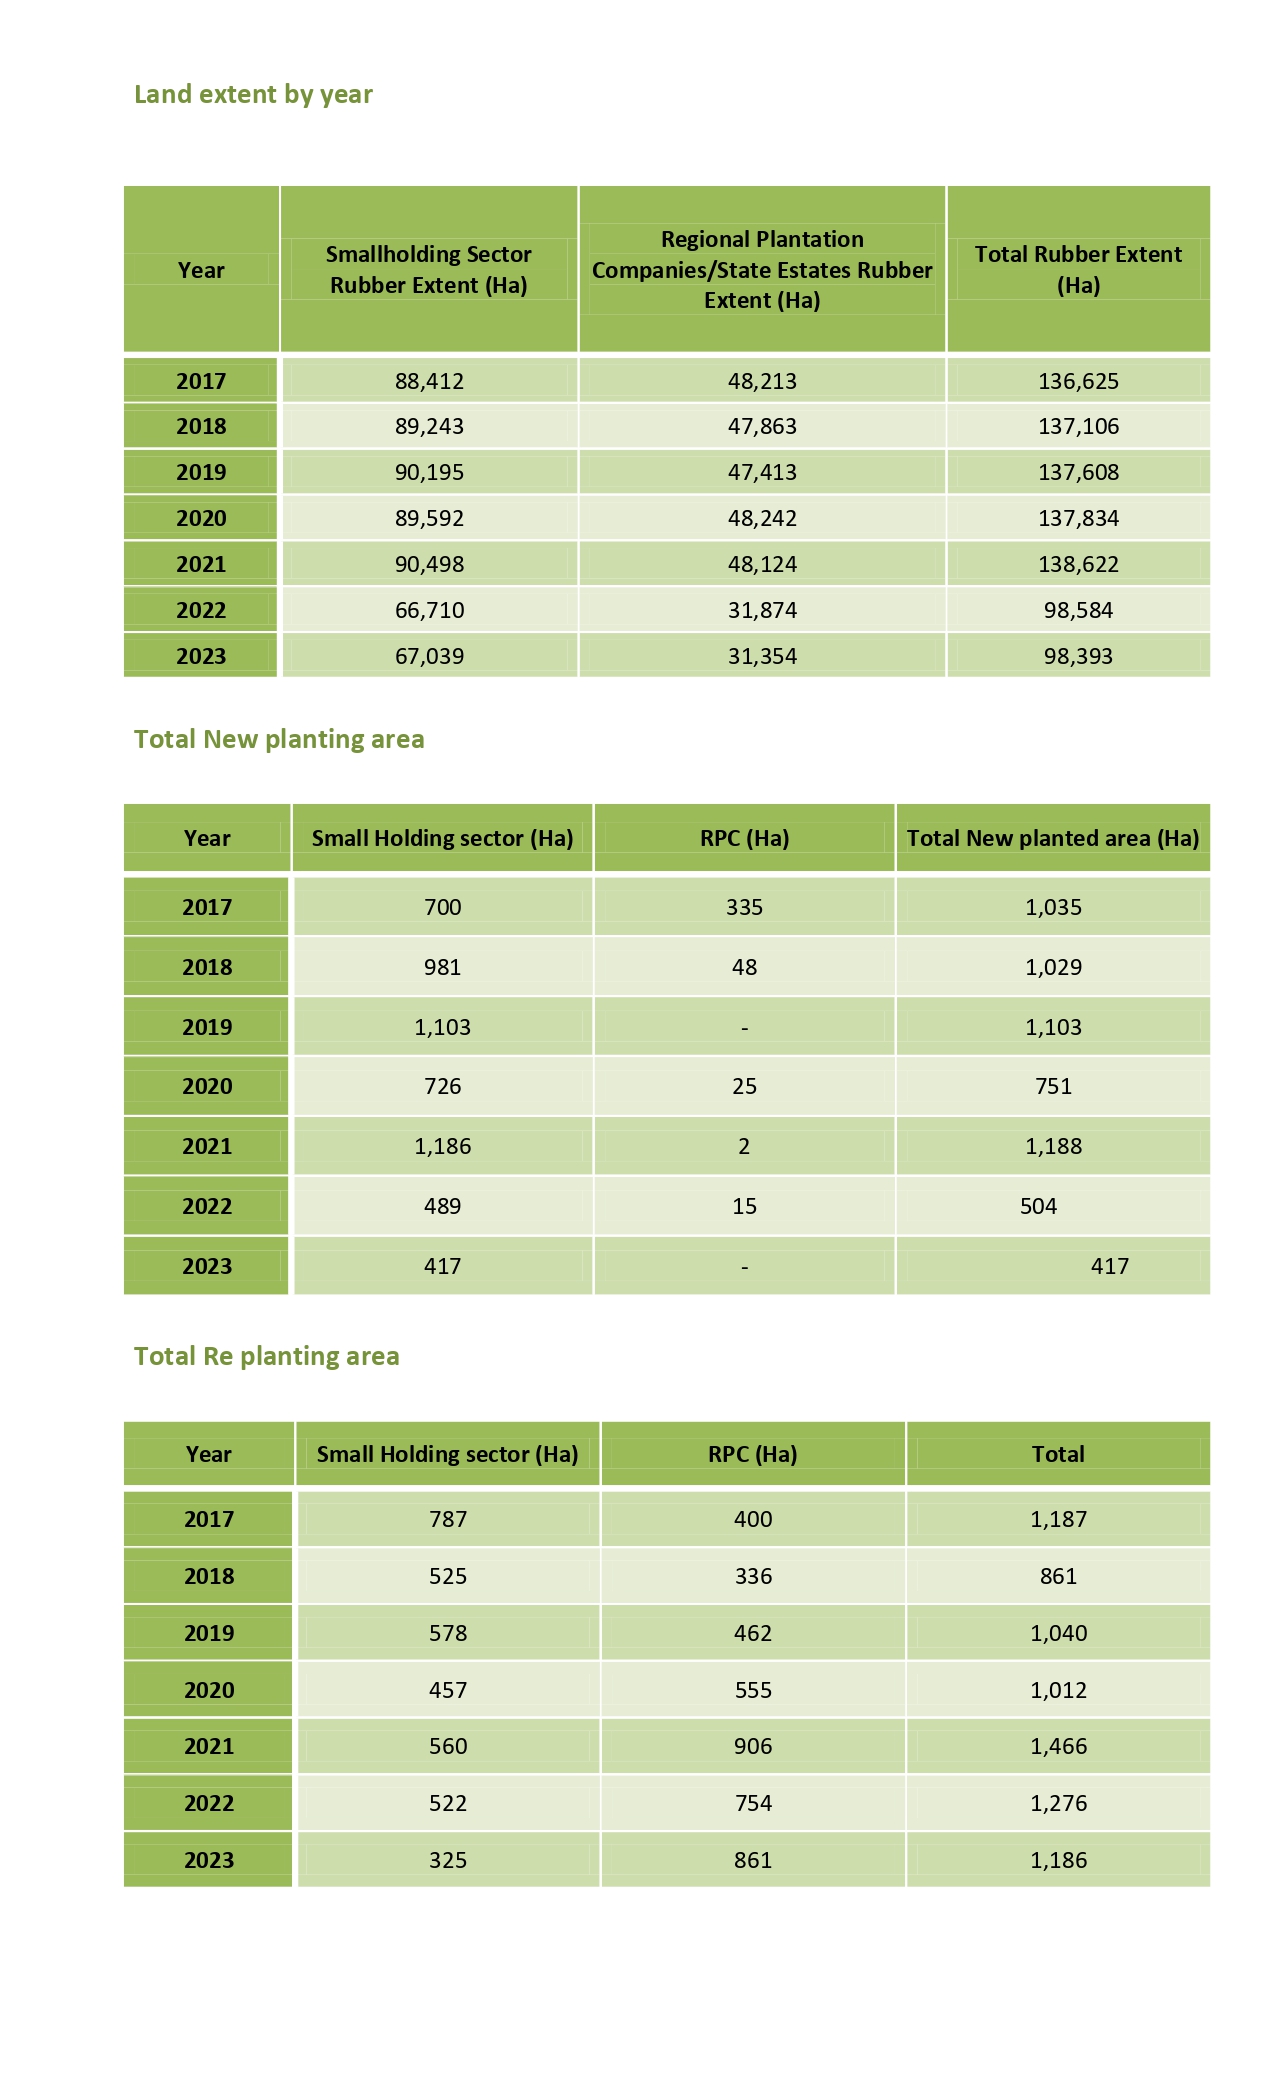
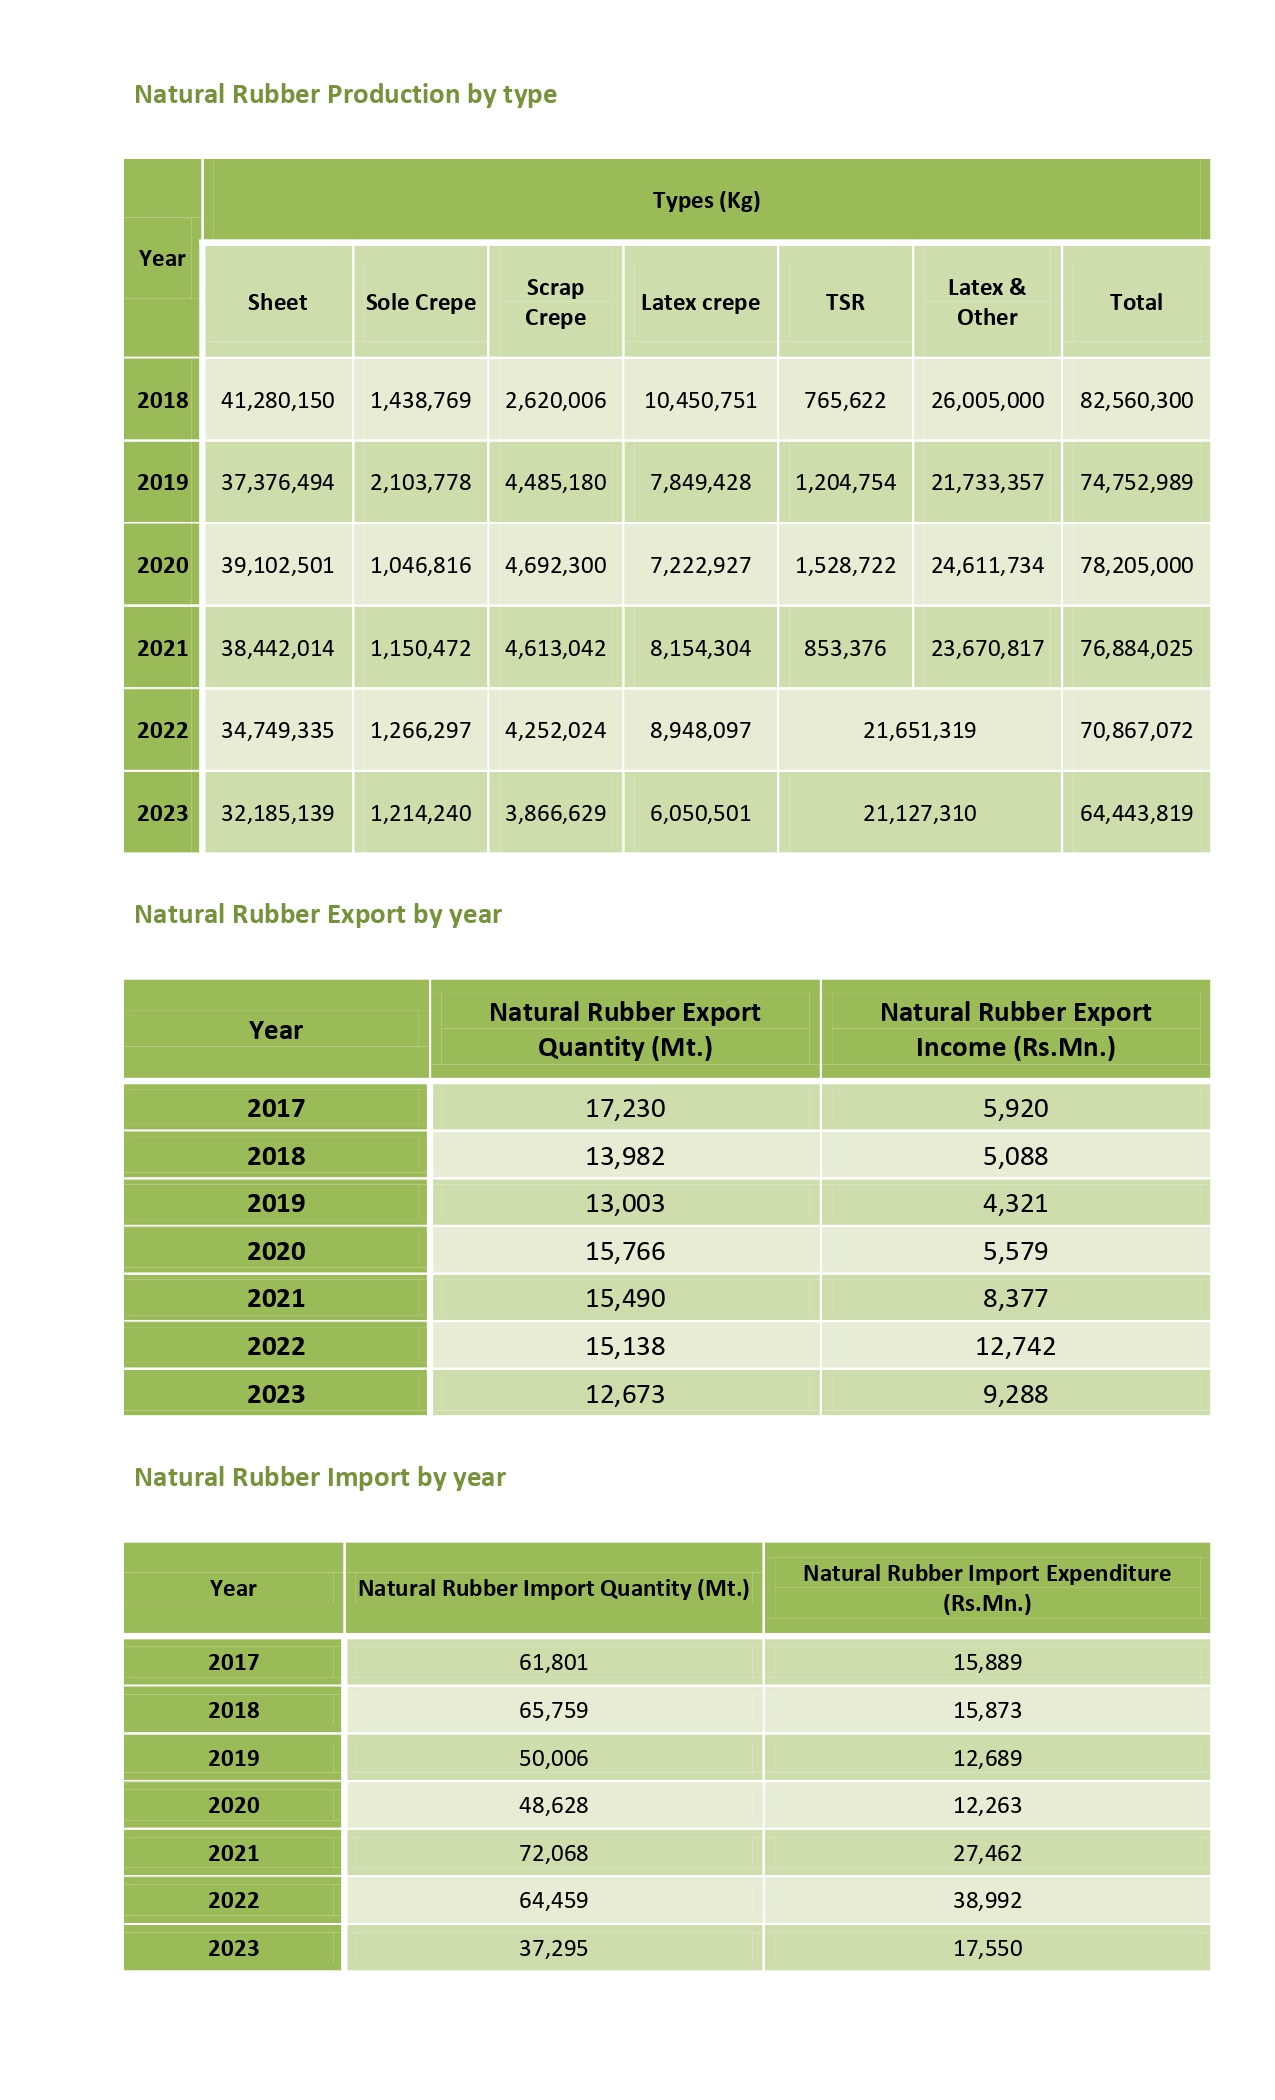
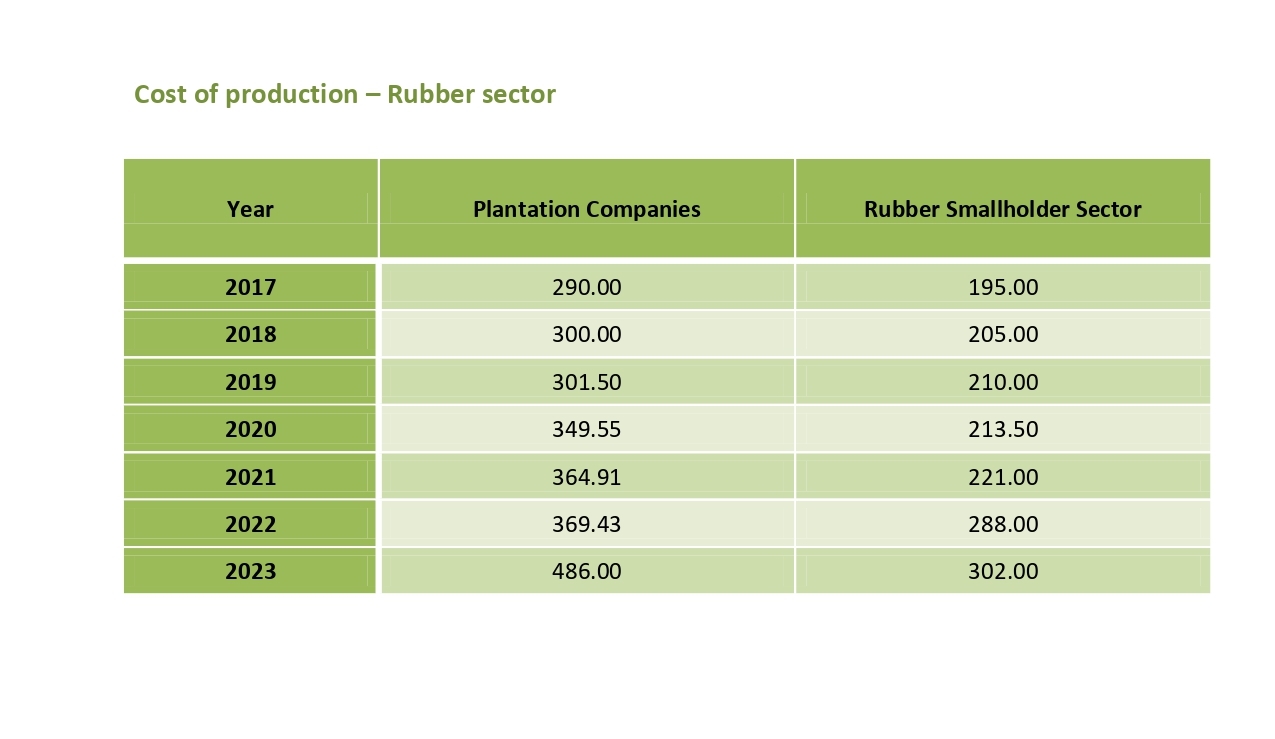
සංඛ්යා ලේඛන
සංඛ්යාලේඛන
FaLang translation system by Faboba