Sinhala (Sri Lanka)
தமிழ் (இந்தியா)
Search
Home
About Us
Overview
Organizational Structure
Our Team
Vacancies
Regions
Regional Offices
Government Nurseries
RDO Divisions
Services
New Planting / Replanting
Rubber Plant Production
Training and Advisory Services
Issuing Dealer License
Registration of Manufacturers
Issuing Permits for Nurseries
Insurance Scheme
Gallery
Photo Gallery
Video Gallery
Downloads
Application Forms
Acts and Regulations
Performance Reports
Publications
RDD
RRI
Statistics
Contact
Inquiry
Contact Details
NEWS
Home
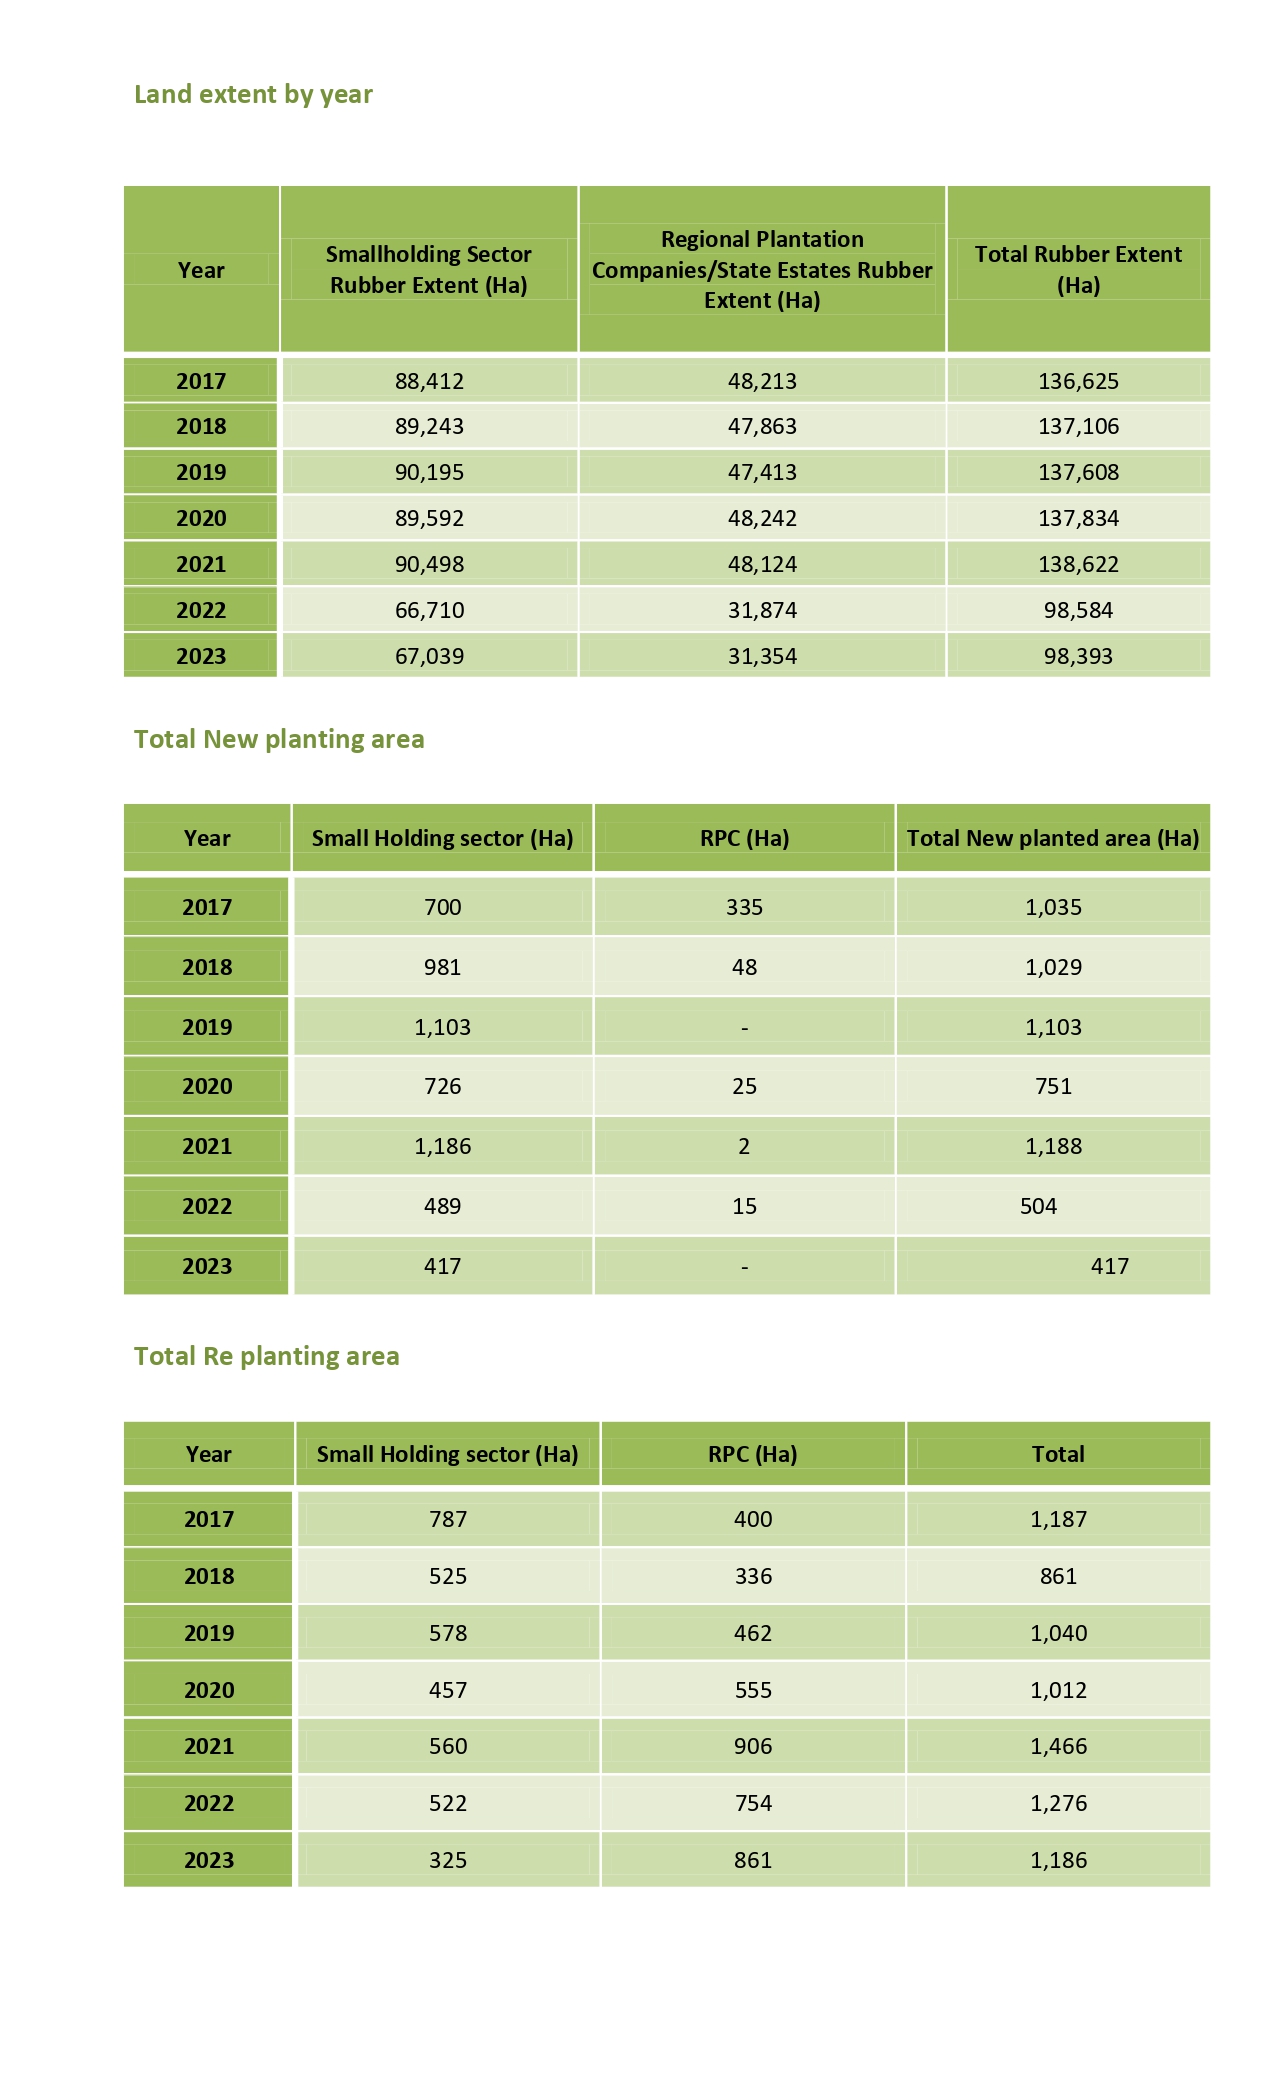
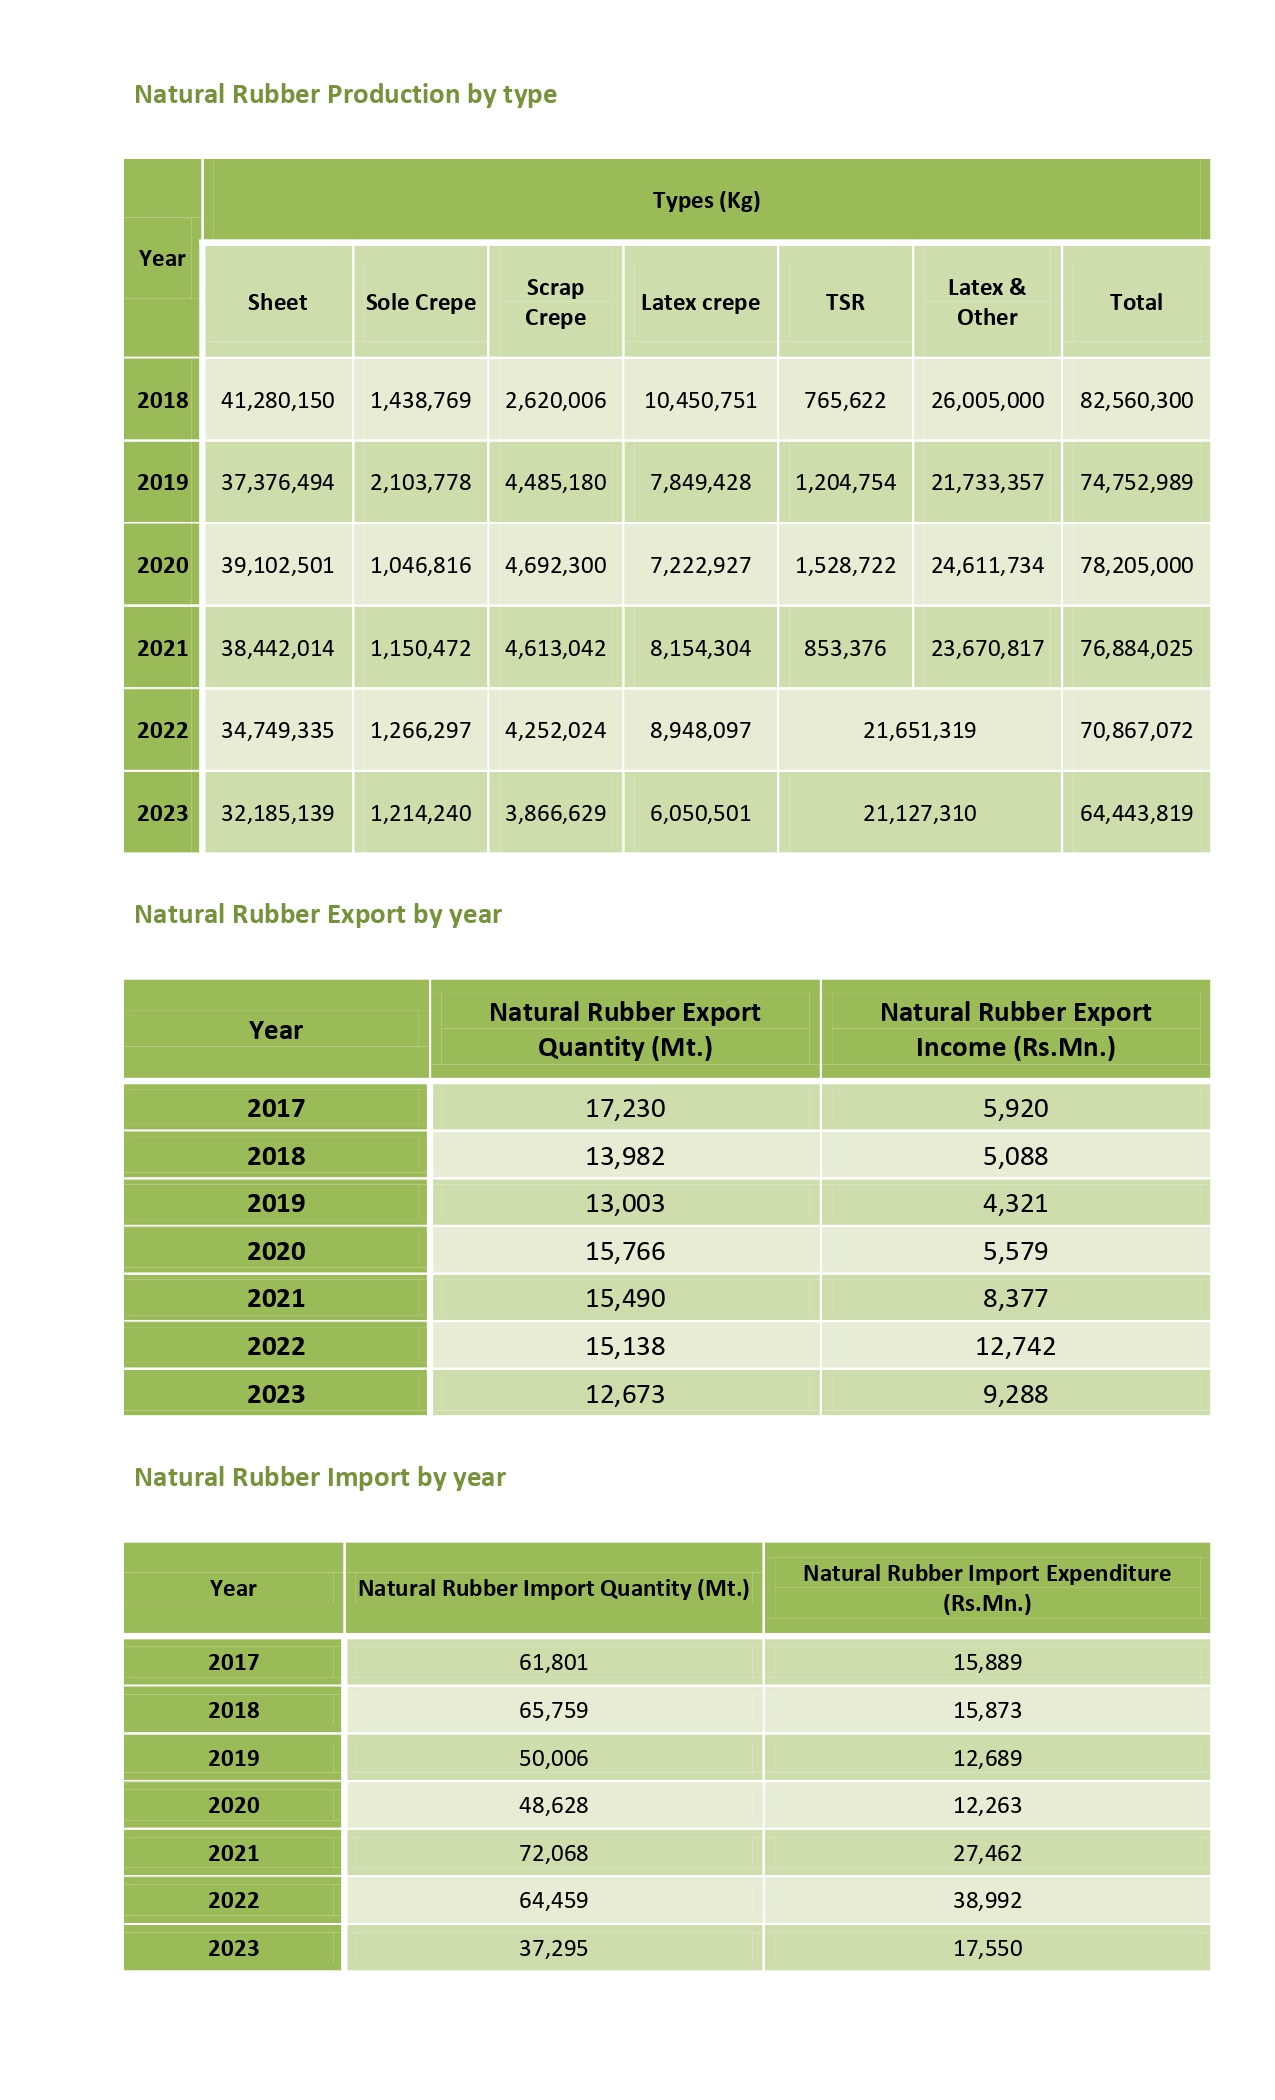
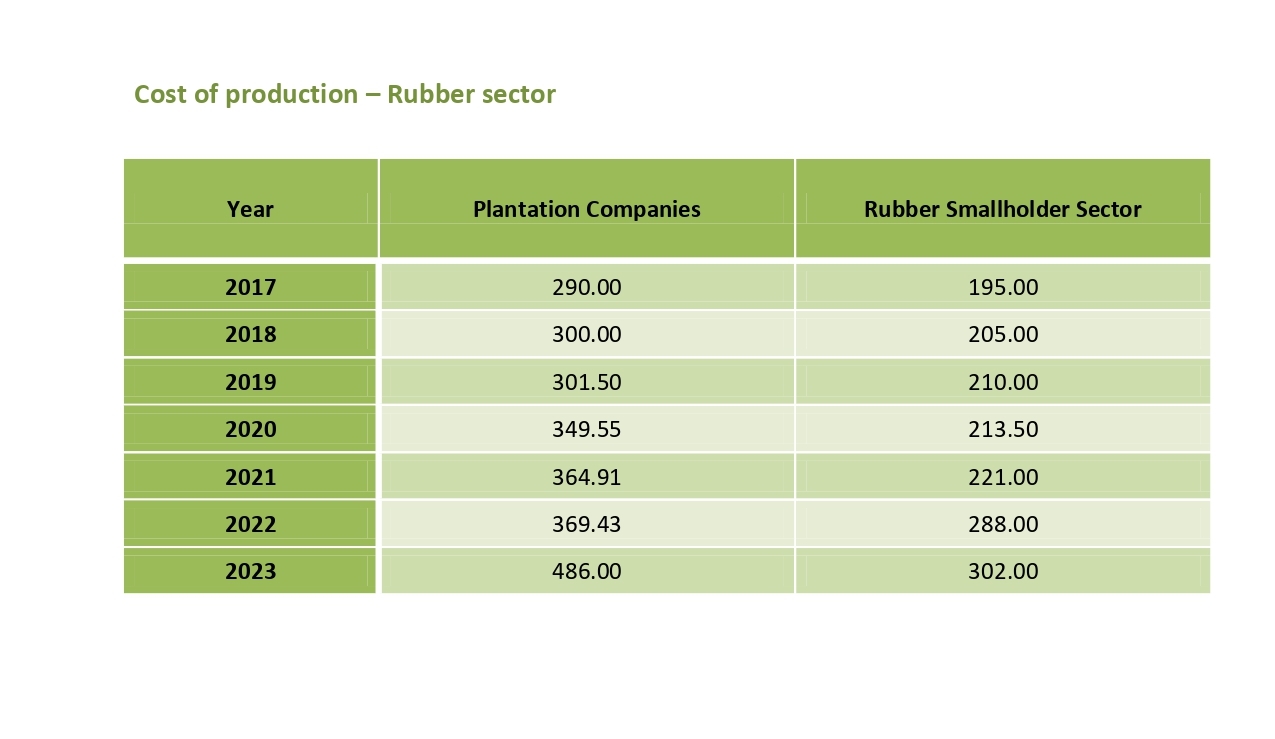
Statistics
Statistics
FaLang translation system by Faboba